Image Processing
I was introduced to image processing through the Robotics Club during my bachelor's degree. Later, I played with the image processing libraries in Matlab to learn the basics. The knowledge and experience I gained in image processing helped me in unexpected ways during my PhD and small projects. In addition, my curiosity in programming helped me to try out new things in image processing.
Image processing is essentially the manipulation of digital images using computer algorithms. It has many applications in fields as diverse as medicine, astronomy and security. In medicine, it is used to analyse medical images to diagnose disease and plan treatment. In astronomy, it is used to enhance and analyse images of celestial bodies. In security, it is used to recognise faces and detect anomalies in surveillance footage.
- Area of applications
- Medical Imaging: analyzing medical images to diagnose and treat diseases.
- Surveillance: detecting anomalies in surveillance footage, face recognition, and tracking objects.
- Remote Sensing: analyzing satellite images to monitor weather, vegetation, land use, and environmental changes.
- Automotive Industry: improving driving safety by detecting obstacles and driver monitoring.
- Entertainment: creating special effects in movies, video games, and virtual reality.
- Quality Control: inspecting products to ensure they meet quality standards.
- Biometrics: recognizing individuals based on their physical characteristics such as fingerprints, iris, and facial features.
- Agriculture: monitoring crop growth, identifying pests, and detecting plant diseases.
- Security: detecting weapons and explosives in X-ray images.
- Previous work
- Particle Image Velocimetry (PIV)
- Digital Image Correlation (DIC)
- Signal Processig & Fast Fourier Transform (FFT)
Image Processing is one of the fields that has gained immense publicity with the recent developments in automation and the emergence of Machine Learning. Some of the commonly seen applications using image processing are:
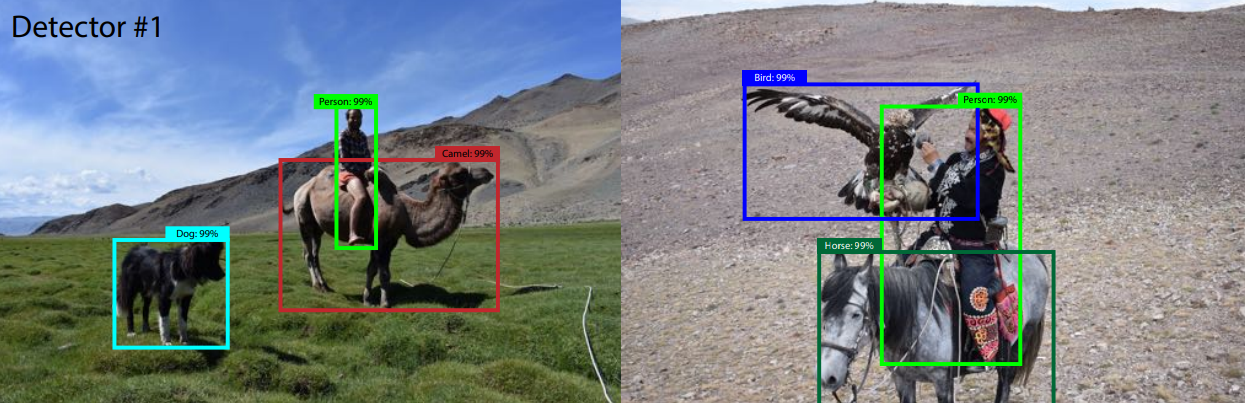
Object detection using Image Processing. A better version of a the YOLO (You Only Look Once, YOLO3) algorithm is used here to detect and identify the objects.
In the past I have worked on several projects involving image processing. The two most important ones are described here.
During my bachelors, I did an internship at NAL (National Aerospace Laboratories, India). They were testing different types of aerospace structures for different purposes, including airflow around different shapes. Wind tunnels are usually used to study the flow and PIV (Particle Image Velocimetry) is used to visualise the flow in the desired region.
Particle Image Velocimetry (PIV) is a non-intrusive optical method used to measure the velocity of fluids. It works by seeding the fluid with small particles and using a laser to illuminate the particles, then capturing their motion with high-speed cameras. PIV is widely used in fluid dynamics research, engineering, and industrial applications to understand flow behavior and optimize design.
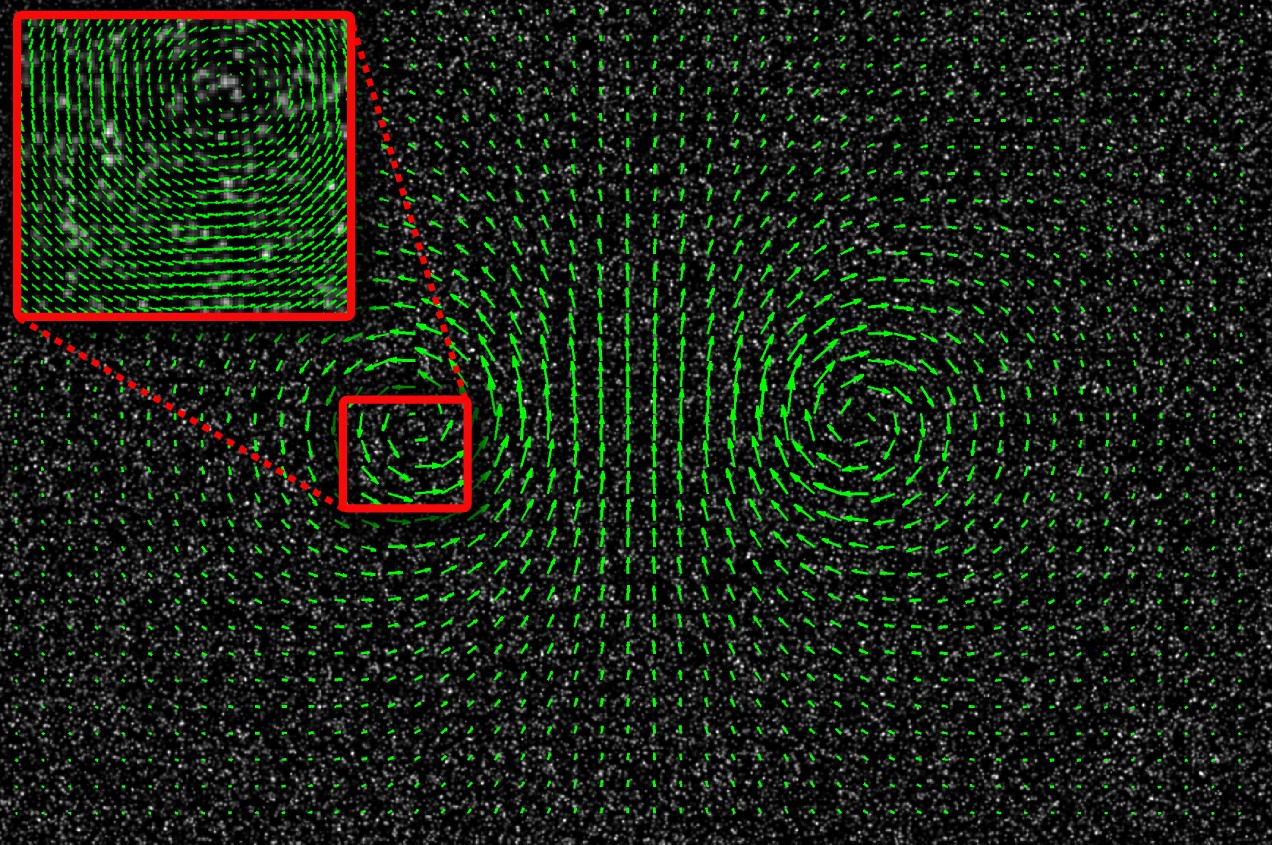
The particles in two different images are tracked to find how much they have been moved, thus 2D velocity field. With an additional camera at a different angle, 3D velocity/displacement field can be captured, called stereo PIV (from wikipedia).
My PhD involved experimental analysis of materials which required various kinds of testing. Some of the tests were using camera to study the full displacement fields on the specimen.
The technique used in DIC is very similar to that of the PIV. It works by tracking the displacement of small patterns on the material's surface between two images. DIC is widely used in materials science and engineering to study the behavior of materials under stress, to optimize designs, and to improve the reliability of structures. Later, this experience has helped me for the PhD, where I had to do similar work in Digital Image Correlation (DIC). To examine the material/damage properties of materials, I loaded them under various conditions while taking pictures at different instances. These pictures were compared to find the distortion of the specimen. The experience with image processing was extremely helpful for the noise removal and for better accuracy.
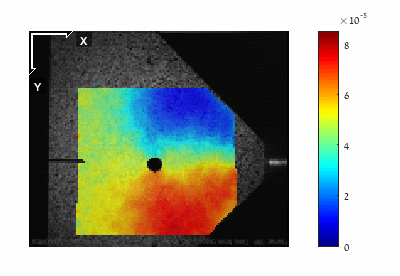
A series of images are taked during the fracture of this specimen and each of them are compared with the reference (initial, unloaded) image to find the deformation at the surface of the specimen. The graphics shows the vertical displacement field in meter.
FFT is one of the most commonly used techniques but we are unaware of it. When we use electric or other forms of signals is the equipments, it requires various operations such as filtering, noise removal, isolations... and most of them are employed using Fourier Transform. FFT stands for Fast Fourier Transform, which is an algorithm used to transform a time-domain signal into a frequency-domain representation. It is a commonly used technique in signal processing, digital image processing, and audio processing. The FFT algorithm has a faster computational time compared to the standard Fourier Transform, making it useful for processing large amounts of data.
FFT has numerous applications in digital image processing, such as image filtering, compression, and analysis. By converting an image from the spatial domain to the frequency domain using FFT, it is possible to analyze its frequency components and filter out unwanted frequencies. The FFT can also be used for image compression by keeping only the most significant frequency components. In addition, FFT can be used for image registration, which involves aligning images that have been taken from different perspectives or at different times. Finally, FFT can be used for image analysis, such as edge detection, image segmentation, and texture analysis, by analyzing the frequency content of the image.

One of the common uses of Fourier Transform. A digital, rectangular signal is converted in to a combination of sinusolidal frequencies with corresponding amplitudes. As the number of terms in the series increases, the accuracy of the representation increases as well (from wikipedia).